Inside Developer Economics 2013
- Jun 15, 2013
- 6 min read
As in previous years, WIP supported Vision Mobile’s research into the economics of the mobile developer space, resulting in its latest Developer Economics report. The report is based on a large survey of mobile developers, and always generates a lot of interesting data points for developer programs to consider. The WIP team has again taken an in-depth look at the report to highlight the key takeaways for your program, and to offer some deeper analysis of the data in it.
Developer Platform Thinking
One always-interesting set of data from the report is that around developer platform mindshare. It found that Android currently captures 71% of developers, followed by iOS at 56% and HTML5 at 52%. The figures aren’t too different since a year ago, apart from a 10-point drop for iOS, which could reflect new mobile developers flocking to Android rather than the Apple platform.
Perhaps more interesting is what’s going on at the other end of the spectrum. 21% of developers are using Windows Phone, down from 37% last year; the percentage of developers using BlackBerry 10 or BlackBerry 5/6/7 both remain around 15%, which is down a staggering 20 points from last year.
Key takeaways here:

User reach remains critical. Neither Windows Phone or BlackBerry can offer a user base anywhere near the size of Android or iOS, and there’s no getting around this fact for most developers.
How do you judge BlackBerry? As noted, the share of both BB10 and its legacy platforms are around 15%, meaning the BlackBerry team has done a great job navigating the transition to the new platform. But that 15% probably presents the choir in the old “preaching to the choir” saying. Without some good news on the device sales front, BlackBerry will continue to struggle to attract new converts.
HTML5 is really catching on. Over half of developers say they’re using HTML5, highlighting its importance in their toolkit. However, this shouldn’t be interpreted as developing for platforms like Firefox OS, but rather reflects developers using HTML5 alongside native code simply as a development tool rather than a distinct platform.
Another cool feature of the report is its “intentshare” figures, which ask developers which platforms they plan to pick up in the coming year. We can look back at last year’s figures to get a sense of the momentum in the developer space:
Windows Phone: last year, 57% of the developers surveyed said they planned to adopt Windows Phone. This has fallen to 35% this year, a significant dropoff. Coupled with the sharp drop in developers saying they’re using the platform, as noted above, the perception and usage problem facing Microsoft and its OEMs like Nokia is clear.
Firefox: 27% of developers say they’re planning to adopt Firefox OS, which is roughly the same percentage as those who say they’ll adopt BlackBerry 10. The two platforms are at similar stages of their lifecycle and neither has much reach – but they do represent two fairly different user bases that would seem to have very different commercial prospects for developers. But Firefox OS has a good story around it from a cool developer brand, and it resonates well. Even if the proof isn’t in the pudding for Firefox OS, it can stand as a good marketing case study.
Tizen: Just 12% of developers say they’re interested in adopting Tizen in the next year, and it will be an uphill battle to attract them in the face of stronger competitors.
Picking Platforms
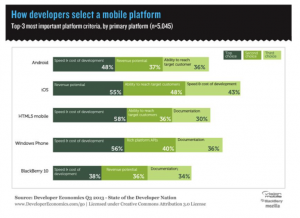
There really are no secrets in how developers choose platforms to work on. As we mentioned above, user reach is crucial, and the survey found two other top metrics across all platforms: revenue potential and speed/cost of development.
These factors are then broken down by developers’ primary platform, and there are some interesting results. Across the 5 major platforms cited (Android, iOS, HTML5, Windows Phone and BB10), speed and cost of development was cited as the most important factor for developers on all of them, except iOS, where revenue potential was first. This makes sense – if the revenues offered by iOS are higher than other platforms (which we will come to later in the article), developers will be prepared to put up with higher costs and longer dev cycles there.
While these factors are talked about in relation to developers choosing a platform, they’re also important to consider when you are marketing to developers on those platforms. They will reflect how developers will evaluate tools, APIs and SDKs. Tools and resources need to be easy to work with so as not to slow down development, and pricing is, as always, crucial. Unless the tool can let the developer bring in more revenue or create time and cost savings on the development side, developers won’t be willing to pay much, if anything, for it.
The Cross-Platform Question
Vision Mobile reports that developers in their survey are using an average of 2.9 platforms, and this is the first time since 2011 that the figure has grown. But what does that really mean? Are developers targeting three distinct platforms or operating systems, with their vastly different ecosystems and technologies?
It’s not clear from the report exactly how this question was asked, and it could be interpreted in a number of different ways. For instance, a developer who has played around with BB10 might say they used that platform, as opposed to someone who is actively developing on it. Furthermore, considering HTML5 as a distinct platform likely muddies this data point further, with many developers using it as a supporting technology or tool rather than solely as a platform.
That said, some of the data around multiple platforms does raise some useful points. The Android-iOS duopoly remains incredibly strong with developers. 67% of developers say they use Android or iOS as their primary platform (with another 17% claiming HTML5).
Where’s the Money Coming From – And How?
The survey reveals that iOS developers are generating $5,200 per month on average, about 10% more than Android. This is significantly different from last year’s report on a number of fronts:
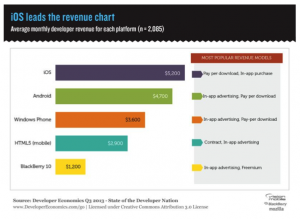
The top platform last year was BlackBerry; BB10 has now fallen to the bottom of the five major platforms at just $1,200 per month, a 70% drop.
The high figure in last year’s survey was $3,900 per month, so the top end of the range has grown by 33%.
iOS average revenue is up 40%, while Android revenue grew a stunning 72%, highlighting the healthy app economy.
The gap between iOS and Android average earnings has narrowed from 35% last year to just 10% this year, further illustrating that Android’s monetization problems are lessening.
How developers are making money on each platform varies. The pay-per-download model is most popular on Windows Phone and BlackBerry 10, presumably because competition from free apps is not yet as strong in these markets. In-app purchasing is significantly stronger on iOS than other platforms, likely because of the low friction of such a model on the platform. Meanwhile, contract work or commissioned apps are the most popular platform for HTML5, since there are very few pure HTML5 app stores, and the platform is very popular for enterprise development.
In-app advertising remains strong across multiple platforms, but it should be noted that these figures track the models used by developers, rather than the amount of revenue being generated by each one.

What Third-Party Tools and Services Are Developers Using?
A new question in this edition of the survey asked developers what third-party services and tools they use in their apps. User analytics were the most popular, followed by cross-platform tools, push notifications and ad networks.
The most popular types of tools should be easy to predict based on developers’ feelings from above on why they choose certain platforms. The most important criteria there, were the speed/cost of development and revenue potential. The story is largely the same here, as developers are interested in services that help them increase revenues (such as user analytics and ad networks) or cut development cost and time (like cross-platform tools or game development tools).
What’s interesting is that outside of push notifications, “feature” tools and services don’t really enter in to the results. Just 6% of developers report using voice services such as Twilio, while just 16% say they use operator APIs. Again, this could be a function of the way the question was phrased or the choices respondents were given, which seems likely given the absence of popular services such as mapping services or social networking from the list.
Still, the overall point holds: that without clear connections to how developers can use a tool or service to increase their revenues or reduce their costs, it’s a hard sell.
What Drives Mobile Developers?
One final point from the report covers what the company behind it labels “The Hierarchy of Developer Motivations”. It’s a crucial question for any developer program or marketer: what are the motivations of developers? Again, the caveat that this data is based on selections from a list applies, but some general takeaways can be useful.
The two most cited motivations were related to personal fulfillment: “Being creative/sense of self-achievement” and “The fun of building an app”. Keep in mind that developers aren’t solely driven by business; they want to have fun and to achieve something as well.
Following the above two motivations, three of the next four most popular were around building a business or making money, as one might expect. But the high percentage of developers citing the personal motivations (53% and 40%) accounts for more than just the hobbyist crowd. Keeping this in mind when building out your program’s activities and messages will help strike the right chord with developers.

Tagged: #VisionMobile, #DeveloperEconomics, #Platforms, #Android, #iOS, #HTML5, #Apple, #BlackBerry, #WindowsPhone, #FirefoxOS, #Tizen, #CrossPlatform, #apps
Comments